> ## Documentation Index
> Fetch the complete documentation index at: https://docs.deductive.ai/llms.txt
> Use this file to discover all available pages before exploring further.
# Connect your stack
> One sitting. Connect every relevant tool at once so the agent can reason across all of it. Not a "pick one and come back later" exercise.
This is the single highest-leverage page in admin setup. The more sources you connect in this one sitting, the more reasoning surface Deductive has from day one.
By the end of this page, every category that matters to your team has at least one green connector and the agent has been verified to actually see your data.
## Before you start: gather credentials
Five minutes of prep saves an hour of context switching. Open a tab for each tool you'll connect and have these handy:
* **GitHub.** Org-admin access (for the GitHub App install path), or a PAT with `repo` scope.
* **Observability provider.** Typically Datadog, Grafana, or Prometheus. API key + app key + site/URL.
* **Incident provider.** PagerDuty, Incident.io, or Rootly. Read API key.
* **Errors / traces.** Sentry, Rollbar. Auth token.
* **Logs (deep).** If your team uses Splunk, Elasticsearch, OpenSearch, Loki, or Sumo Logic. Endpoint + token.
* **Cloud.** AWS access. Either an IAM role ARN (preferred) or an access key pair with read-only policies.
* **Tickets.** Jira. Domain + email + API token.
* **Internal alert URL patterns.** If your team has in-house alerting, grab one example alert message so you can write a regex against it later.
## The recommended day-one set
If you're starting cold and want a sane minimum, this combo covers most teams:
1. **Code.** GitHub
2. **Observability.** Datadog *or* Grafana *or* Prometheus
3. **Incidents.** PagerDuty *or* Incident.io
4. **Errors.** Sentry
5. **Cloud.** AWS
Adding more later is fine, but doing the first five together is what makes investigations cross-correlate properly.
## Open the integrations index
Open **Settings → Integrations**. Connected sources show a green dot; everything else is one click from a setup wizard.
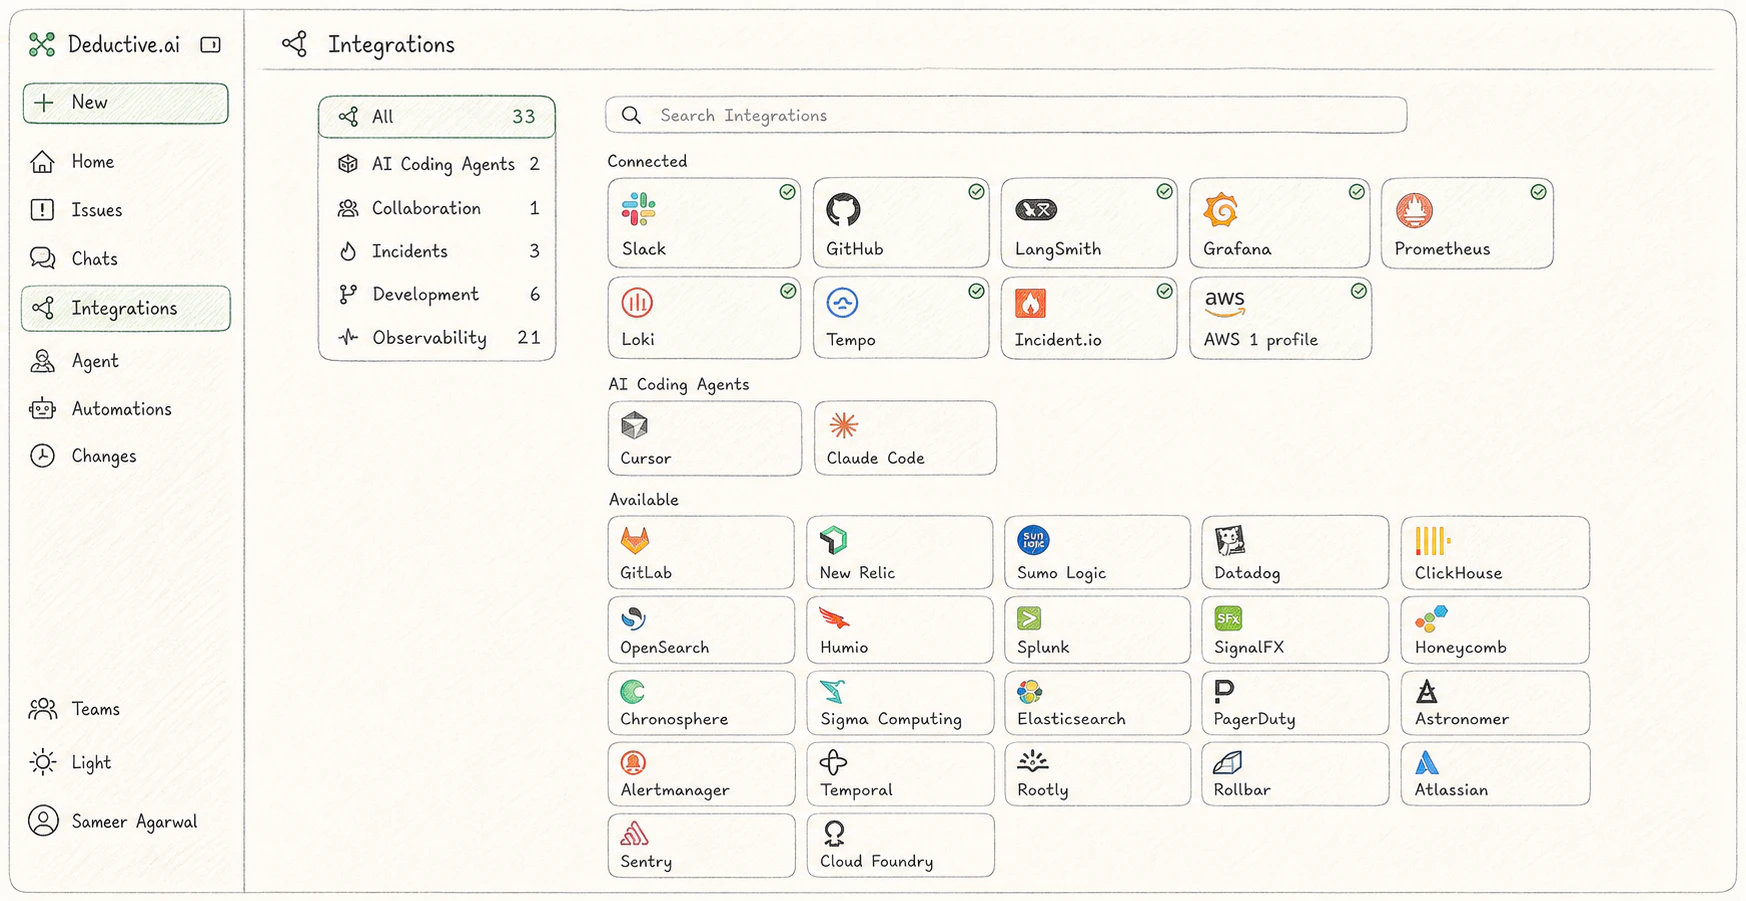 Work through the sections below in order. Each section is a compact "credentials → connect → test" walkthrough; deep per-field reference is one click away on each connector's dedicated page.
***
## Code
The fastest, safest path is the **Deductive GitHub App** for `github.com`.
1. **Settings → Integrations → GitHub → Install GitHub App**.
2. GitHub redirects to its app installation page. Choose the org and the repos you want Deductive to read. Read access is enough. Deductive never writes to your repos.
3. Confirm. The connector flips to a green dot when GitHub's callback completes.
If your repos live on GitHub Enterprise Server, or you'd rather use a token: use **GitHub PAT** instead. Generate a PAT with `repo` scope at GitHub **Settings → Developer settings → Personal access tokens**, paste it into Deductive along with your hostname (`github.com` or `github.yourcompany.com`, no `https://`, no trailing slash), click **Test connection**.
Per-field detail and edge cases: [GitHub integration](/integrations/github).
***
## Observability
Pick at least one. Most teams have a primary metric/log provider; connect that one first. Adding more later is fine.
The safest path is a **read-only service account** so Deductive sees observability data only.
1. In Datadog, create (or reuse) a service account and assign it the **Datadog Read Only** role.
2. From the service account, create a **Datadog Application Key** with **Unscoped** scope. (Unscoped app keys automatically include the read permissions you need.)
3. Create a standard **Datadog API Key** for authentication.
4. Note your Datadog **site** (`datadoghq.com`, `datadoghq.eu`, `us3.datadoghq.com`, etc.).
5. In Deductive, paste API key + app key + site into **Settings → Integrations → Datadog**, click **Test connection**.
Detail: [Datadog integration](/integrations/datadog).
Service-account token is the modern path; API key is the legacy path.
1. In Grafana, navigate to **Administration → Users And Access → Service accounts**.
2. **Add service account** with role **Editor** or **Admin**.
3. **Add service account token**, copy the `glsa_…` token immediately.
4. Note your Grafana URL: for cloud, `your-org.grafana.net`; for self-hosted, the bare domain (no `https://`, no path).
5. In Deductive, paste URL + token into **Settings → Integrations → Grafana**, click **Test connection**.
Detail: [Grafana integration](/integrations/grafana).
For self-hosted Prometheus or any Prometheus-compatible query API.
1. Determine your Prometheus query endpoint (e.g. `https://prometheus.example.com`).
2. If your endpoint is auth-protected, gather the credential it requires (basic auth, bearer token, etc.).
3. In Deductive, paste the endpoint and credential into **Settings → Integrations → Prometheus**, click **Test connection**.
Detail: [Prometheus integration](/integrations/prometheus).
1. In New Relic, generate a **User API key** under **API keys**.
2. Note your account region (`us` or `eu`).
3. Paste both into **Settings → Integrations → New Relic** in Deductive. Click **Test connection**.
Detail: [New Relic integration](/integrations/newrelic).
***
## Incidents
Pick the one your team uses. If you have multiple (e.g. PagerDuty for paging, Incident.io for IM), connect both.
1. In PagerDuty: **Integrations → Developer Tools → API Access Keys → Create New API Key**.
2. Pick **Read-only**.
3. Copy the key (PagerDuty only shows it once).
4. Paste into **Settings → Integrations → PagerDuty** in Deductive. **Test connection**.
Detail: [PagerDuty integration](/integrations/pagerduty).
1. In Incident.io: **Settings → API keys → Create new API key**.
2. Grant the standard read scopes for incidents and post-incident actions.
3. Paste into **Settings → Integrations → Incident.io** in Deductive. **Test connection**.
Detail: [Incident.io integration](/integrations/incidentio).
1. In Rootly: **Settings → API keys → New API key**.
2. Grant read scopes for incidents.
3. Paste into **Settings → Integrations → Rootly** in Deductive. **Test connection**.
Detail: [Rootly integration](/integrations/rootly).
***
## Errors & traces
1. In Sentry: **Settings → Auth Tokens → Create New Token**.
2. Grant `event:read`, `org:read`, `project:read`.
3. Paste token + your Sentry org slug into **Settings → Integrations → Sentry** in Deductive. **Test connection**.
Detail: [Sentry integration](/integrations/sentry).
1. In Rollbar: **Account Settings → Account Access Tokens → Create new token**.
2. Choose `read` scope.
3. Paste into **Settings → Integrations → Rollbar** in Deductive. **Test connection**.
Detail: [Rollbar integration](/integrations/rollbar).
***
## Cloud
The recommended path is a cross-account IAM role with read-only managed policies.
1. In AWS: **IAM → Roles → Create Role**.
2. Select **AWS account** as the trusted entity. Set the trust policy to allow Deductive's account ID (shown in **Settings → Integrations → AWS** in Deductive).
3. Attach `ReadOnlyAccess` (or a tighter custom read policy if your team prefers).
4. Optionally set an **External ID** for additional security.
5. Note the role ARN (`arn:aws:iam:::role/`) and your primary AWS region.
6. Paste role ARN + region (and external ID if used) into Deductive. **Test connection**.
Static access keys are also supported as a fallback. See the deep page if your team can't grant cross-account roles.
Detail: [AWS integration](/integrations/aws).
***
## Deep logs (optional)
If your team's primary log provider isn't already covered above, connect it here.
1. In Splunk: **Settings → Tokens → New Token**.
2. Note your Splunk endpoint (e.g. `https://splunk.example.com:8089`).
3. Paste endpoint + token into **Settings → Integrations → Splunk** in Deductive. **Test connection**.
Detail: [Splunk integration](/integrations/splunk).
1. Note your cluster endpoint and an API key or basic-auth credential with read access on the indices you want Deductive to query.
2. Paste into **Settings → Integrations → \[Elasticsearch | OpenSearch]** in Deductive. **Test connection**.
Detail: [Elasticsearch](/integrations/elasticsearch) | [OpenSearch](/integrations/opensearch).
1. Note your Loki endpoint (Grafana Cloud users: `logs-prod-X.grafana.net`).
2. Generate a Grafana service-account token with logs read access (or use basic auth for self-hosted).
3. Paste into **Settings → Integrations → Loki** in Deductive. **Test connection**.
Detail: [Loki integration](/integrations/loki).
1. In Sumo Logic: **Manage Data → Access Keys → Add Access Key**.
2. Paste access ID + access key + endpoint into **Settings → Integrations → Sumo Logic** in Deductive. **Test connection**.
Detail: [Sumo Logic integration](/integrations/sumologic).
***
## Tickets & alert routing
1. In Atlassian: **Account Settings → Security → API Tokens → Create API Token**.
2. Note your Jira domain (`yourcompany.atlassian.net`, no `https://`).
3. Paste domain + your Atlassian account email + token into **Settings → Integrations → Jira** in Deductive. **Test connection**.
Detail: [Jira integration](/integrations/jira).
For Prometheus-based alerting where you want Deductive to see alert lifecycle (firing/resolving) in addition to the metrics that triggered them.
1. Note your Alertmanager endpoint.
2. Paste into **Settings → Integrations → Alertmanager** in Deductive. **Test connection**.
Detail: [Alertmanager integration](/integrations/alertmanager).
***
## Test every connection
Each connector has a **Test connection** button. **Click it for every connector you added.** Don't skip. A successful test does three things at once:
* Validates the credential against the upstream API
* Lists at least one resource (a repo, a metric scope, an incident) so you can confirm Deductive can actually read data
* Flips the connector to a green dot in the integrations index
Work through the sections below in order. Each section is a compact "credentials → connect → test" walkthrough; deep per-field reference is one click away on each connector's dedicated page.
***
## Code
The fastest, safest path is the **Deductive GitHub App** for `github.com`.
1. **Settings → Integrations → GitHub → Install GitHub App**.
2. GitHub redirects to its app installation page. Choose the org and the repos you want Deductive to read. Read access is enough. Deductive never writes to your repos.
3. Confirm. The connector flips to a green dot when GitHub's callback completes.
If your repos live on GitHub Enterprise Server, or you'd rather use a token: use **GitHub PAT** instead. Generate a PAT with `repo` scope at GitHub **Settings → Developer settings → Personal access tokens**, paste it into Deductive along with your hostname (`github.com` or `github.yourcompany.com`, no `https://`, no trailing slash), click **Test connection**.
Per-field detail and edge cases: [GitHub integration](/integrations/github).
***
## Observability
Pick at least one. Most teams have a primary metric/log provider; connect that one first. Adding more later is fine.
The safest path is a **read-only service account** so Deductive sees observability data only.
1. In Datadog, create (or reuse) a service account and assign it the **Datadog Read Only** role.
2. From the service account, create a **Datadog Application Key** with **Unscoped** scope. (Unscoped app keys automatically include the read permissions you need.)
3. Create a standard **Datadog API Key** for authentication.
4. Note your Datadog **site** (`datadoghq.com`, `datadoghq.eu`, `us3.datadoghq.com`, etc.).
5. In Deductive, paste API key + app key + site into **Settings → Integrations → Datadog**, click **Test connection**.
Detail: [Datadog integration](/integrations/datadog).
Service-account token is the modern path; API key is the legacy path.
1. In Grafana, navigate to **Administration → Users And Access → Service accounts**.
2. **Add service account** with role **Editor** or **Admin**.
3. **Add service account token**, copy the `glsa_…` token immediately.
4. Note your Grafana URL: for cloud, `your-org.grafana.net`; for self-hosted, the bare domain (no `https://`, no path).
5. In Deductive, paste URL + token into **Settings → Integrations → Grafana**, click **Test connection**.
Detail: [Grafana integration](/integrations/grafana).
For self-hosted Prometheus or any Prometheus-compatible query API.
1. Determine your Prometheus query endpoint (e.g. `https://prometheus.example.com`).
2. If your endpoint is auth-protected, gather the credential it requires (basic auth, bearer token, etc.).
3. In Deductive, paste the endpoint and credential into **Settings → Integrations → Prometheus**, click **Test connection**.
Detail: [Prometheus integration](/integrations/prometheus).
1. In New Relic, generate a **User API key** under **API keys**.
2. Note your account region (`us` or `eu`).
3. Paste both into **Settings → Integrations → New Relic** in Deductive. Click **Test connection**.
Detail: [New Relic integration](/integrations/newrelic).
***
## Incidents
Pick the one your team uses. If you have multiple (e.g. PagerDuty for paging, Incident.io for IM), connect both.
1. In PagerDuty: **Integrations → Developer Tools → API Access Keys → Create New API Key**.
2. Pick **Read-only**.
3. Copy the key (PagerDuty only shows it once).
4. Paste into **Settings → Integrations → PagerDuty** in Deductive. **Test connection**.
Detail: [PagerDuty integration](/integrations/pagerduty).
1. In Incident.io: **Settings → API keys → Create new API key**.
2. Grant the standard read scopes for incidents and post-incident actions.
3. Paste into **Settings → Integrations → Incident.io** in Deductive. **Test connection**.
Detail: [Incident.io integration](/integrations/incidentio).
1. In Rootly: **Settings → API keys → New API key**.
2. Grant read scopes for incidents.
3. Paste into **Settings → Integrations → Rootly** in Deductive. **Test connection**.
Detail: [Rootly integration](/integrations/rootly).
***
## Errors & traces
1. In Sentry: **Settings → Auth Tokens → Create New Token**.
2. Grant `event:read`, `org:read`, `project:read`.
3. Paste token + your Sentry org slug into **Settings → Integrations → Sentry** in Deductive. **Test connection**.
Detail: [Sentry integration](/integrations/sentry).
1. In Rollbar: **Account Settings → Account Access Tokens → Create new token**.
2. Choose `read` scope.
3. Paste into **Settings → Integrations → Rollbar** in Deductive. **Test connection**.
Detail: [Rollbar integration](/integrations/rollbar).
***
## Cloud
The recommended path is a cross-account IAM role with read-only managed policies.
1. In AWS: **IAM → Roles → Create Role**.
2. Select **AWS account** as the trusted entity. Set the trust policy to allow Deductive's account ID (shown in **Settings → Integrations → AWS** in Deductive).
3. Attach `ReadOnlyAccess` (or a tighter custom read policy if your team prefers).
4. Optionally set an **External ID** for additional security.
5. Note the role ARN (`arn:aws:iam:::role/`) and your primary AWS region.
6. Paste role ARN + region (and external ID if used) into Deductive. **Test connection**.
Static access keys are also supported as a fallback. See the deep page if your team can't grant cross-account roles.
Detail: [AWS integration](/integrations/aws).
***
## Deep logs (optional)
If your team's primary log provider isn't already covered above, connect it here.
1. In Splunk: **Settings → Tokens → New Token**.
2. Note your Splunk endpoint (e.g. `https://splunk.example.com:8089`).
3. Paste endpoint + token into **Settings → Integrations → Splunk** in Deductive. **Test connection**.
Detail: [Splunk integration](/integrations/splunk).
1. Note your cluster endpoint and an API key or basic-auth credential with read access on the indices you want Deductive to query.
2. Paste into **Settings → Integrations → \[Elasticsearch | OpenSearch]** in Deductive. **Test connection**.
Detail: [Elasticsearch](/integrations/elasticsearch) | [OpenSearch](/integrations/opensearch).
1. Note your Loki endpoint (Grafana Cloud users: `logs-prod-X.grafana.net`).
2. Generate a Grafana service-account token with logs read access (or use basic auth for self-hosted).
3. Paste into **Settings → Integrations → Loki** in Deductive. **Test connection**.
Detail: [Loki integration](/integrations/loki).
1. In Sumo Logic: **Manage Data → Access Keys → Add Access Key**.
2. Paste access ID + access key + endpoint into **Settings → Integrations → Sumo Logic** in Deductive. **Test connection**.
Detail: [Sumo Logic integration](/integrations/sumologic).
***
## Tickets & alert routing
1. In Atlassian: **Account Settings → Security → API Tokens → Create API Token**.
2. Note your Jira domain (`yourcompany.atlassian.net`, no `https://`).
3. Paste domain + your Atlassian account email + token into **Settings → Integrations → Jira** in Deductive. **Test connection**.
Detail: [Jira integration](/integrations/jira).
For Prometheus-based alerting where you want Deductive to see alert lifecycle (firing/resolving) in addition to the metrics that triggered them.
1. Note your Alertmanager endpoint.
2. Paste into **Settings → Integrations → Alertmanager** in Deductive. **Test connection**.
Detail: [Alertmanager integration](/integrations/alertmanager).
***
## Test every connection
Each connector has a **Test connection** button. **Click it for every connector you added.** Don't skip. A successful test does three things at once:
* Validates the credential against the upstream API
* Lists at least one resource (a repo, a metric scope, an incident) so you can confirm Deductive can actually read data
* Flips the connector to a green dot in the integrations index
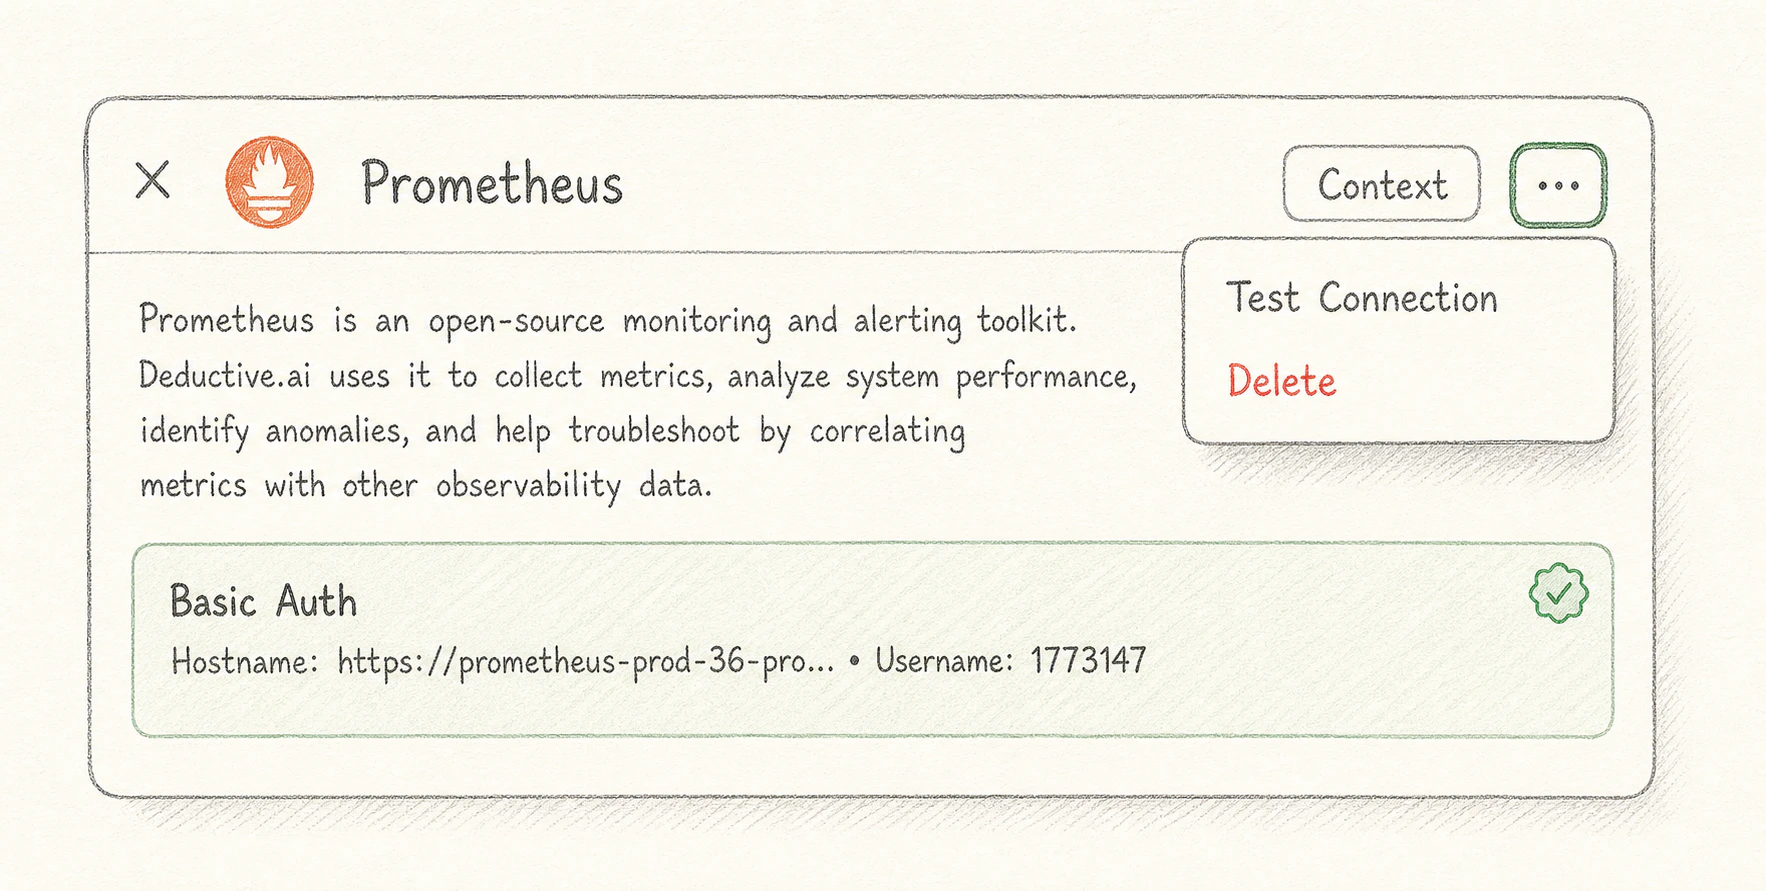 If any test fails, Deductive shows the upstream error verbatim. Fix the underlying credential or scope issue and retest before moving on.
## Verify the cross-source agent works
Once you have at least three categories green (e.g. GitHub + Datadog + PagerDuty), kick off a real investigation as a smoke test. From the home page, ask:
> "Summarize last week's incidents and group them by likely cause. For each cause, point at the code change or config change that likely produced it."
If the answer references both **specific incidents** (proves the incident connector is reading) and **specific commits or PRs** (proves the code connector is reading), the cross-source reasoning is working. You're done with the hardest part.
## What just happened
You set up the workspace's data plane in one sitting. Every connector you added is now indexing. Small accounts catch up in minutes, larger ones over the next couple of hours. None of your team has to repeat this work; they just sign in.
## Try this next
Install the Slack workspace bot. After this, your team can wire alerts into Deductive themselves.
If any test fails, Deductive shows the upstream error verbatim. Fix the underlying credential or scope issue and retest before moving on.
## Verify the cross-source agent works
Once you have at least three categories green (e.g. GitHub + Datadog + PagerDuty), kick off a real investigation as a smoke test. From the home page, ask:
> "Summarize last week's incidents and group them by likely cause. For each cause, point at the code change or config change that likely produced it."
If the answer references both **specific incidents** (proves the incident connector is reading) and **specific commits or PRs** (proves the code connector is reading), the cross-source reasoning is working. You're done with the hardest part.
## What just happened
You set up the workspace's data plane in one sitting. Every connector you added is now indexing. Small accounts catch up in minutes, larger ones over the next couple of hours. None of your team has to repeat this work; they just sign in.
## Try this next
Install the Slack workspace bot. After this, your team can wire alerts into Deductive themselves.